Capteur de distance Micro:bit Projet Servomoteur
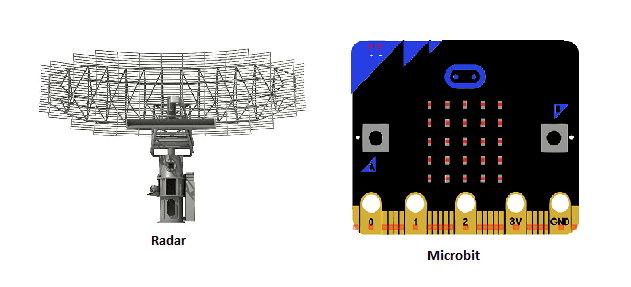
Réalisation d’un radar contrôlé par Micro:bit
Un radar est un système qui utilise des ondes radio pour détecter la présence, la distance et la vitesse d’objets à proximité. Les radars sont largement utilisés dans de nombreuses applications, notamment la navigation aérienne, la surveillance de la circulation routière et la détection des intrusions.
Le fonctionnement d’un radar est basé sur le principe de l’écho. Lorsqu’un signal radio est émis par un radar, il est réfléchi par les objets proches et revient au radar sous forme d’un écho. En mesurant le temps qu’il a fallu au signal pour aller et venir, le radar peut calculer la distance de l’objet. En analysant la fréquence du signal de retour, le radar peut également déterminer la vitesse de l’objet.
Il existe de nombreuses variantes de radars, qui diffèrent par la fréquence des ondes utilisées, la manière de générer et de détecter les ondes, et la façon de traiter les données de retour. Certains radars utilisent des ondes radio à haute fréquence, tandis que d’autres utilisent des ondes microwaves. Les radars peuvent être actifs (qui émettent leur propre signal) ou passifs (qui ne font que détecter les signaux existants).
En résumé, un radar est un outil de détection à distance qui utilise des ondes radio pour repérer et mesurer la distance et la vitesse des objets. Il est utilisé dans de nombreuses applications pour surveiller l’environnement et prendre des décisions en conséquence.
But de ce projet:
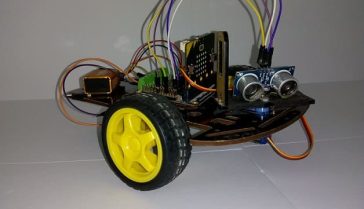
Dans ce projet, nous allons concevoir un radar utilisant la care Micro:bit et un capteur à ultrasons pour la détection.
Ce projet vise à réaliser un prototype de système radar qui détecte les objets fixes et mobiles.
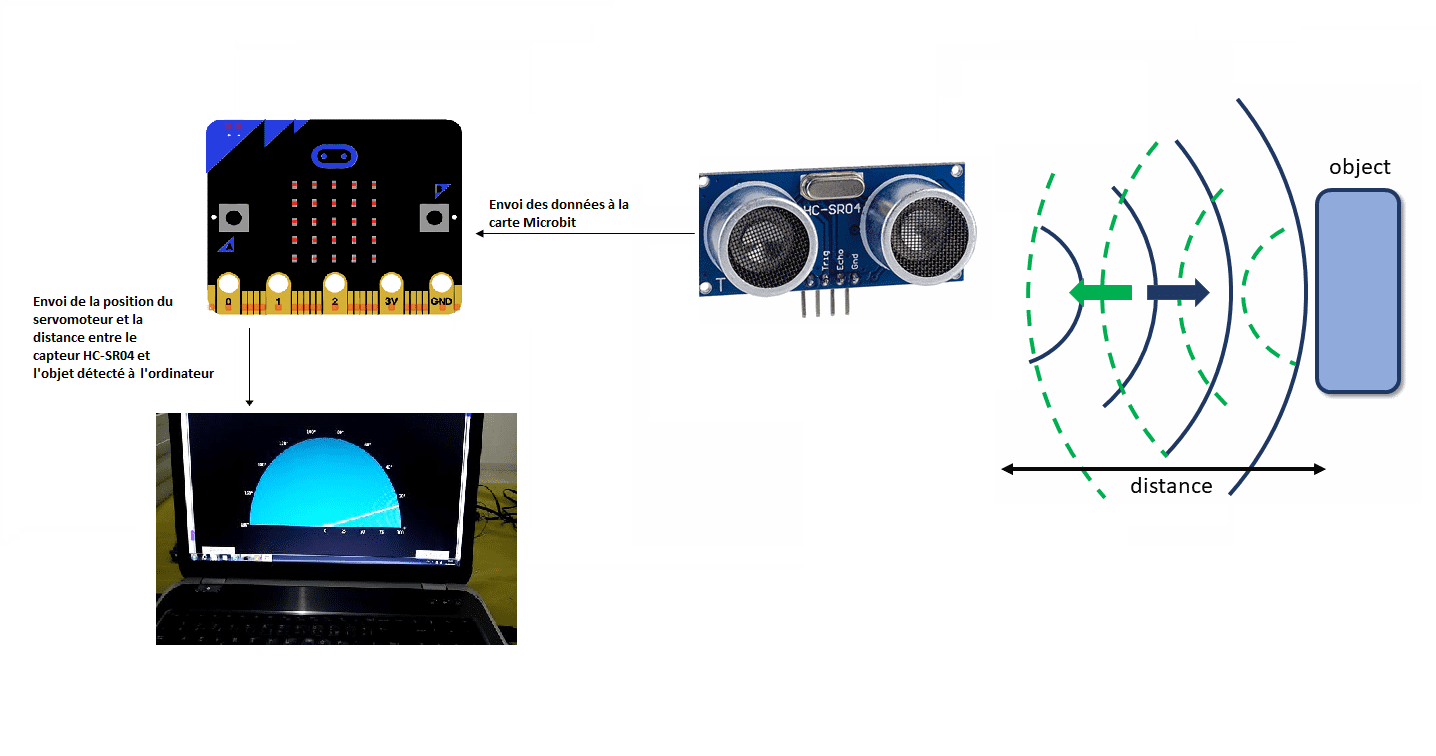
Fonctionnement du radar contrôlé par Microbit:
Composants nécessaires
carte micro:bit
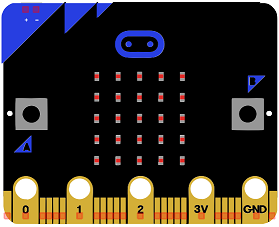
La carte Micro:bit est une carte de développement électronique de petite taille conçue pour l’apprentissage de la programmation et de l’électronique. Il est destiné aux élèves de l’école primaire et du collège et peut être utilisé pour créer des projets de robotique, de domotique et de développement de matériel électronique.
La carte Micro:bit mesure environ 5 cm x 4 cm et est dotée de plusieurs ports et connecteurs pour connecter des capteurs, des actionneurs et d’autres dispositifs électroniques. Elle comprend également un afficheur LED de 5 x 5, un haut-parleur, un accéléromètre et un gyroscope, ainsi qu’une connexion Bluetooth.
La carte Micro:bit peut être programmé en utilisant le langage de programmation Python ou en utilisant des blocs de programmation via un logiciel en ligne comme Microsoft MakeCode. Il est alimenté par une batterie ou par un câble USB et peut être utilisé en tant que dispositif autonome ou connecté à un ordinateur ou à un autre système de contrôle.
La carte Micro:bit est un outil pratique pour les éducateurs et les développeurs qui souhaitent enseigner la programmation et l’électronique de manière interactive et ludique.
Capteur HC-SR04
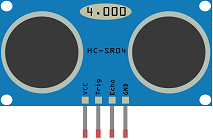
Le capteur HC-SR04 est un capteur de distance à ultrasons qui peut être utilisé pour mesurer la distance entre l’objet et le capteur en envoyant une impulsion ultrasonore et en mesurant le temps qu’il faut pour qu’elle soit renvoyée. Le capteur HC-SR04 comprend deux éléments transducteurs ultrasonores, un émetteur et un récepteur. L’émetteur envoie une impulsion ultrasonore qui est renvoyée par l’objet lorsqu’elle heurte sa surface. Le récepteur reçoit l’impulsion renvoyée et le temps qui s’écoule entre l’envoi de l’impulsion et sa réception est mesuré. La distance de l’objet peut alors être déterminée en utilisant la vitesse de l’onde ultrasonore et le temps mesuré.
carte d’extension GPIO
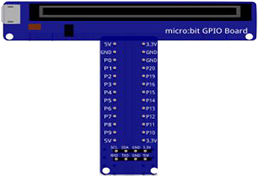
Une carte GPIO (General Purpose Input/Output) est un type de carte qui permet de connecter des appareils externes à un ordinateur ou à un microcontrôleur. Elle possède généralement une série de broches qui peuvent être utilisées pour envoyer et recevoir des signaux numériques et analogiques, ainsi que pour fournir de l’énergie à des appareils externes.
Les cartes GPIO sont souvent utilisées dans les projets de robotique, de domotique et de développement de logiciels, car elles permettent de connecter des capteurs, des actionneurs et d’autres appareils électroniques à un ordinateur ou à un microcontrôleur. Elles peuvent être utilisées pour contrôler et surveiller des systèmes, pour collecter et traiter des données, ou pour développer des applications de commande et de contrôle.
servomoteurs
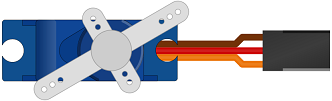
Un servomoteur est un moteur électrique qui peut être utilisé pour commander la position, la vitesse ou la force d’un système mécanique. Les servomoteurs sont souvent utilisés dans les applications de contrôle de mouvement précis, telles que les robots, les systèmes de positionnement et les machines-outils.
Un servomoteur comprend un moteur électrique, un réducteur et un dispositif de commande. Le moteur électrique est utilisé pour fournir la force de déplacement. Le réducteur est utilisé pour réduire la vitesse et augmenter la force du moteur. Le dispositif de commande est utilisé pour contrôler la position, la vitesse ou la force du servomoteur.
Il existe plusieurs types de servomoteurs, qui diffèrent principalement par leur méthode de commande et par leur capacité de déplacement. Les servomoteurs peuvent être commandés par impulsion, par tension ou par courant. Ils peuvent également être classés selon leur capacité de déplacement en servomoteurs linéaires et en servomoteurs rotatifs.
des fils de connexion
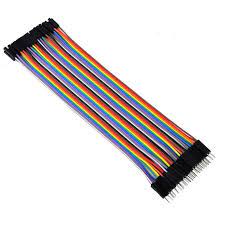
Les fils de connexion sont des fils électriques utilisés pour connecter des composants électroniques à une carte de développement ESP32. Ils sont généralement utilisés pour connecter des capteurs, des actionneurs, des afficheurs et d’autres composants à la carte ESP32 afin de créer des circuits électroniques.
Il existe deux types de fils de connexion: les fils de connexion mâle-mâle et les fils de connexion mâle-femelle. Les fils de connexion mâle-mâle sont utilisés pour connecter des composants qui ont tous deux des broches mâles, tandis que les fils de connexion mâle-femelle sont utilisés pour connecter des composants avec une broche mâle et une broche femelle.
Les fils de connexion sont généralement fabriqués en cuivre ou en alliage de cuivre et sont revêtus d’un isolant en plastique pour protéger les fils électriques et empêcher les courts-circuits. Ils sont disponibles dans une variété de couleurs pour aider à identifier et organiser les différents fils dans un circuit.
Plaque d’essai
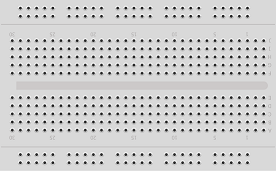
Une plaque d’essai est un type de carte de développement électronique qui permet aux développeurs de tester et de prototyper facilement des circuits électroniques. Elles sont souvent utilisées par les développeurs pour tester rapidement des idées et des conceptions avant de les intégrer à un projet plus important ou de les intégrer dans une carte de développement plus permanente.
Les plaques d’essai sont généralement basées sur un microcontrôleur, qui est un processeur facile à utiliser et à programmer qui peut être utilisé pour contrôler une variété de circuits électroniques. Les plaques d’essai incluent généralement des broches d’extension qui permettent de connecter facilement des composants électroniques tels que des capteurs, des afficheurs, des moteurs et d’autres composants.
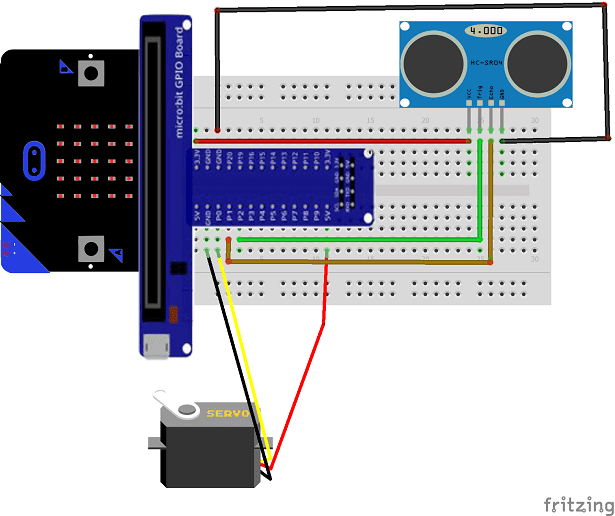
Montage:
Pour faire le montage, on a connecté:
Pour le capteur sonore HC-SR04 :
- la broche VCC à la broche 3.3V du Micro:bit
- la broche Trig à la broche P2 du Micro:bit
- la broche ECHO à la broche P1 du Micro:bit
- la broche GND à la broche GND du Micro:bit
Pour le servomoteur:
- fil rouge : fil de l’alimentation à relier à la borne 5V de la carte GPIO
- fil marron : fil à relier à la broche GND du Micro:bit
- Jaune : fil de signal de positionnement branché à la broche P0 du Micro:bit
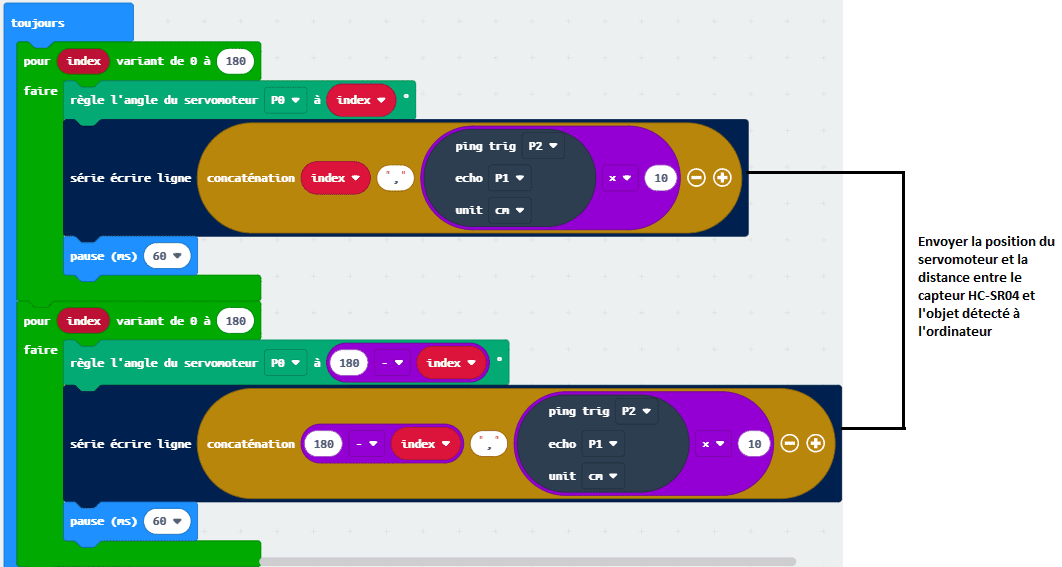
Programme makecode
Voici le programme makecode qui permet de :
- calculer la distance entre le capteur HC-SR04 et l’objet détecté
- faire tourner le servomoteur
- d’envoyer des données (position du servomoteur et la distance) de la carte Micro:bit vers l’ordinateur.
Programme Python exécuté par l’ordinateur
|
1 2 3 4 5 6 7 8 9 10 11 12 13 14 15 16 17 18 19 20 21 22 23 24 25 26 27 28 29 30 31 32 33 34 35 36 37 38 39 40 41 42 43 44 45 46 47 48 49 50 51 52 53 54 55 56 57 58 59 60 61 62 63 64 65 66 67 68 69 70 71 72 73 74 75 76 77 78 79 80 81 82 83 84 85 86 87 88 89 90 91 92 93 94 95 96 97 98 99 100 101 102 103 104 105 106 107 108 109 110 111 112 113 114 115 116 117 118 119 120 121 122 123 124 125 126 127 128 129 130 131 132 133 134 135 136 137 138 |
# Python + Microbit-based Radar Plotter # # ** Works with any motor that outputs angular rotation # ** and with any distance sensor (HC-SR04, VL53L0x,LIDAR) # import numpy as np import matplotlib matplotlib.use('TkAgg') import matplotlib.pyplot as plt from matplotlib.widgets import Button import serial,sys,glob import serial.tools.list_ports as COMs # # ############################################ # Find Microbit ports, select one, then start communication with it ############################################ # port1="COM19" ser = serial.Serial(port1,baudrate=115200) ser.flush() # clear the port # ############################################ # Start the interactive plotting tool and # plot 180 degrees with dummy data to start ############################################ # fig = plt.figure(facecolor='k') win = fig.canvas.manager.window # figure window screen_res = win.wm_maxsize() # used for window formatting later dpi = 150.0 # figure resolution fig.set_dpi(dpi) # set figure resolution # polar plot attributes and initial conditions ax = fig.add_subplot(111,polar=True,facecolor='#006d70') ax.set_position([-0.05,-0.05,1.1,1.05]) r_max = 100.0 # can change this based on range of sensor ax.set_ylim([0.0,r_max]) # range of distances to show ax.set_xlim([0.0,np.pi]) # limited by the servo span (0-180 deg) ax.tick_params(axis='both',colors='w') ax.grid(color='w',alpha=0.5) # grid color ax.set_rticks(np.linspace(0.0,r_max,5)) # show 5 different distances ax.set_thetagrids(np.linspace(0.0,180.0,10)) # show 10 angles angles = np.arange(0,181,1) # 0 - 180 degrees theta = angles*(np.pi/180.0) # to radians dists = np.ones((len(angles),)) # dummy distances until real data comes in pols, = ax.plot([],linestyle='',marker='o',markerfacecolor = 'w', markeredgecolor='#EFEFEF',markeredgewidth=1.0, markersize=10.0,alpha=0.9) # dots for radar points line1, = ax.plot([],color='w', linewidth=4.0) # sweeping arm plot # figure presentation adjustments fig.set_size_inches(0.96*(screen_res[0]/dpi),0.96*(screen_res[1]/dpi)) plot_res = fig.get_window_extent().bounds # window extent for centering win.wm_geometry('+{0:1.0f}+{1:1.0f}'.\ format((screen_res[0]/2.0)-(plot_res[2]/2.0), (screen_res[1]/2.0)-(plot_res[3]/2.0))) # centering plot fig.canvas.toolbar.pack_forget() # remove toolbar for clean presentation fig.canvas.set_window_title('Microbit Radar') fig.canvas.draw() # draw before loop axbackground = fig.canvas.copy_from_bbox(ax.bbox) # background to keep during loop ############################################ # button event to stop program ############################################ def stop_event(event): global stop_bool stop_bool = 1 prog_stop_ax = fig.add_axes([0.85,0.025,0.125,0.05]) pstop = Button(prog_stop_ax,'Stop Program',color='#FCFCFC',hovercolor='w') pstop.on_clicked(stop_event) # button to close window def close_event(event): global stop_bool,close_bool if stop_bool: plt.close('all') stop_bool = 1 close_bool = 1 close_ax = fig.add_axes([0.025,0.025,0.125,0.05]) close_but = Button(close_ax,'Close Plot',color='#FCFCFC',hovercolor='w') close_but.on_clicked(close_event) fig.show() ############################################ # inifinite loop, constantly updating the # 180deg radar with incoming Microbit data ############################################ # start_word,stop_bool,close_bool = True,False,False while True: try: if stop_bool: # stops program fig.canvas.toolbar.pack_configure() # show toolbar if close_bool: # closes radar window plt.close('all') break ser_bytes = ser.readline() # read Microbit serial data decoded_bytes = ser_bytes.decode('utf-8') # decode data to utf-8 #data =ser_bytes.decode('utf-8') #print(data.split(',')) data = (decoded_bytes.replace('\r','')).replace('\n','').replace(' ','') #print(data.split(',')) if start_word: vals = [float(ii) for ii in data.split(',')] print(vals) if len(vals)<2: continue angle,dist = vals # separate into angle and distance if dist>r_max: dist = 0.0 # measuring more than r_max, it's likely inaccurate dists[int(angle)] = dist if angle % 5 ==0: # update every 5 degrees pols.set_data(theta,dists) fig.canvas.restore_region(axbackground) ax.draw_artist(pols) line1.set_data(np.repeat((angle*(np.pi/180.0)),2), np.linspace(0.0,r_max,2)) ax.draw_artist(line1) fig.canvas.blit(ax.bbox) # replot only data fig.canvas.flush_events() # flush for next plot else: if data=='Radar Start': # stard word on Arduno start_word = True # wait for Microbit to output start word print('Radar Starting...') else: continue except KeyboardInterrupt: plt.close('all') print('Keyboard Interrupt') break |
Vous pouvez voir aussi

1 commentaire
Laisser un commentaire

Tutoriels récents


Tutos les plus vus


Tutos les plus commentés


Scroll to Top
Moyon 05-04-2222
Comment faire communiquer la micro-bit avec le simulateur makecode (donc avec l'ordi) pour tracer la courbe avec le simulateur, une fois le programme chargé dans la carte ?